Background
The large block for the North Breakwater in Otaru, Japan made by Dr. Isami Hiroi in 1897, was not natural stone, but rather the first concrete block in Japan. Dr. Hiroi also produced numerous small mortar samples 120 years ago because the long-term durability of cement concrete was unknown at that time. He hoped that the concrete technology of that time could be transmitted to future generations.
About 40,000 small gourd-shaped mortar samples of various compositions were produced at that time. They were then stored under specific control in air, fresh water, and seawater. Dr. Isami Hiroi suggested that the long-term durability of those samples should be assessed using those samples. Those samples have been kept at the Otaru Port Office of the Hokkaido Development Bureau in Otaru.
Those mortar samples, which were produced in the early stages of concrete development, have long been stored. They are also known in foreign countries and are famous worldwide as reliable samples. A large-scale durability study was conducted of these samples in November 1995 (100 years after construction). However, unfortunately, the deterioration of mortar samples of the three types has been inadequately investigated.
In fact, no appropriate method exists for evaluating the cement concrete deterioration phenomenon even today. The internal cracks and deterioration state remain unknown. Therefore, at the time of an earlier study (1995), it could not be determined which of the three types of mortar samples was the most durable.
Highlight 1 (crack)
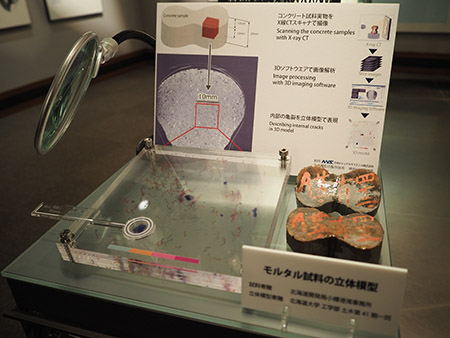
Comparison was made of deterioration between a 120 year mortar sample kept indoors and a new mortar sample. The 120 year mortar sample that had been kept in a room had deteriorated somewhat. However, it was reportedly healthy, although showing some damage. Nevertheless, plastic models and posters illustrate its robust character in terms of cracks and deterioration, compared with a newly produced mortar sample.
As for cracks, cement concrete generally fractures when the crack width exceeds 0.2 mm. Therefore, such cracks must be repaired. Cracks of narrower width present almost no difficulty. In an earlier study, the crack width generally was measurable only on the concrete surface, but internal cracks and deterioration of the sample have remained unknown until now.
The latest micro focus computed tomography scanning (CT) technology and Nihon Visual Science (NVS Co. Ltd.)) technology can use color displays to show the crack shape, crack width, crack position, and deterioration status in a three-dimensional state, even inside the sample.
Results enable visualization, at a glance, of the shape and extent of cracks and deteriorations in a sample like a plastic model (here) using a three-dimensional color display of cement concrete.
Highlight 2 (Deterioration)
Regarding deterioration, although cement concrete consists of several substances that have hardened, the deterioration has been evaluated to date only by the chemical change of a single component. Recently, several chemical components in cement concrete have been found to change to amorphous substances because of deterioration.
However, because amorphous substances are extremely unstable, it has remained impossible to identify the location at which this substance exists. Here, we specifically examined the fact that when it deteriorated, the black-and-white image measured using CT technology becomes blacker and the specific gravity of the material becomes smaller.
The deteriorated black part (amorphous substance) in the sample can be extracted from the CT image. The degree of deterioration of the cement concrete can be displayed as a blue color (lump), so that it can be seen at a glance using a plastic model (here).
The blue part of the lump shows that deterioration had progressed considerably. Therefore, if many blue lumps exist, it can be said that the sample had deteriorated. The image shows that the 120 year mortar sample shows markedly less damage when compared to the cracking and deterioration of new mortar sample using modern cement, as presented in Fig. 1, Fig. 2, and Table 1.
Conventional evaluation of deterioration of a concrete sample is examined by application of phenolphthalein solution, which is one method for judging the deterioration of cement concrete. When this test was conducted on the fracture surface of the 120-year mortar sample, the entire cross section was colorless, indicating that the entire cross section of the sample had deteriorated. However, this result might be attributable to the fact that the determination method using phenolphthalein solution is overly sensitive to minute deterioration. In fact, minute deteriorations in this plastic model (here) can be observed as follows. From this model, it is apparent that the central part in the sample had deteriorated slightly, similarly to the blue lump, but this sample (120-year mortar sample in air) had not deteriorated in all sections.
Model description: internal cracks and deterioration
Table 1 presents deterioration and cracking of the 120 years-mortar sample and the newly established mortar sample.
Deterioration of both mortar samples shows that the crack state can be evaluated based on crack width of 0.2 mm and/or wider in a three-dimensional state inside and the amount of black material shown on a CT image. In this plastic model, the color lines represented by the fluorescent color indicate cracks. The blue lumps represent deteriorated parts.
Fig. 1 shows a 120 years-mortar sample kept indoors. Fig. 2 shows the new mortar sample obtained 30 days after construction produced using commercially available ordinary Portland cement. They were compared using three-dimensional CT images. The latter sample shows numerous cracks of fluorescent color of 0.2 mm and/or wider and many blue lumps. Results suggest that the new mortar sample deteriorated markedly by 30 days after construction on the surface and inside the sample, as shown in Table 1. Moreover, the new mortar sample shows that the range of the void ratio is wider, the average void ratio is also larger, and that there are many wider cracks exist (yellow: 0.276 mm, yellow-green: 0.414 mm, blue: 0.552 mm).
In contrast, the 120 years-mortar sample, as shown in the plastic model and Table 1, exhibits very little damage despite having been stored for 120 years, there is cracking and deterioration.
Data of a 120-year old mortar sample in a room and a new mortar sample obtained 30 days after construction
Table 1 Voids and cracks of two samples
120-year mortar sample New mortar sample
indoor 30 days after construction
(Void ratio) 3.25% 14.2%
(Range 0.0001–1 mm3 0.02–10 mm3
of void) (avg.: 0.02 mm3) (avg.: 0.2 mm3)
Crack width and the ratio of crack width to the whole sample (%)
0.05 mm (Red, 41.83%) 0.138 mm (Red, 67.6%)
0.1 mm (Yellow, 48.06%) 0.276 mm (Yellow, 30.8%)
0.15 mm (Green, 9.44%) 0.414 mm (Yellow-green, 1.6%)
0.2 mm (Blue, 0.66%) 0.552 mm (Blue, 0.01%)
0.25 mm (Purple, 0.0081%)
Here, the bold fluorescent color represents a crack width of 0.2 mm or wider.
Comparison of the crack ratio with crack width of 0.276 mm or wider for all samples is the following.
new mortar sample / 120 year mortar sample in room
(30.8%+1.6%+0.01%)/0.0081%=4001%
In terms of crack width, Table 1 shows that the deterioration of the modern new mortar sample (30 days after construction) is about 4000 times greater than that of the 120-year mortar sample kept in the room.
Fig. 1 120-year mortar sample Fig. 2 New mortar sample
indoor 30 days after construction
(Crack distribution) (Crack distribution)
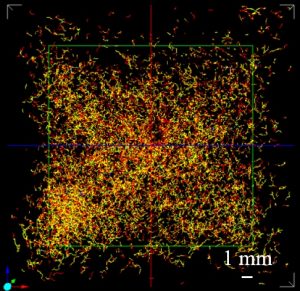
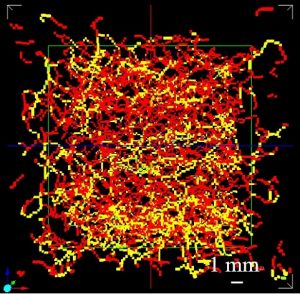
Red (0.05 mm)–Purple (Blue)(0.025 mm) Red (0.138 mm)–Purple (Blue)(0.552 mm)
Crack width: 0.05–0.025 mm (5 Color) Crack width: 0.138–0.552 mm (4 Color)
Ratio of void : 3.25% Ratio of void : 14.2%
